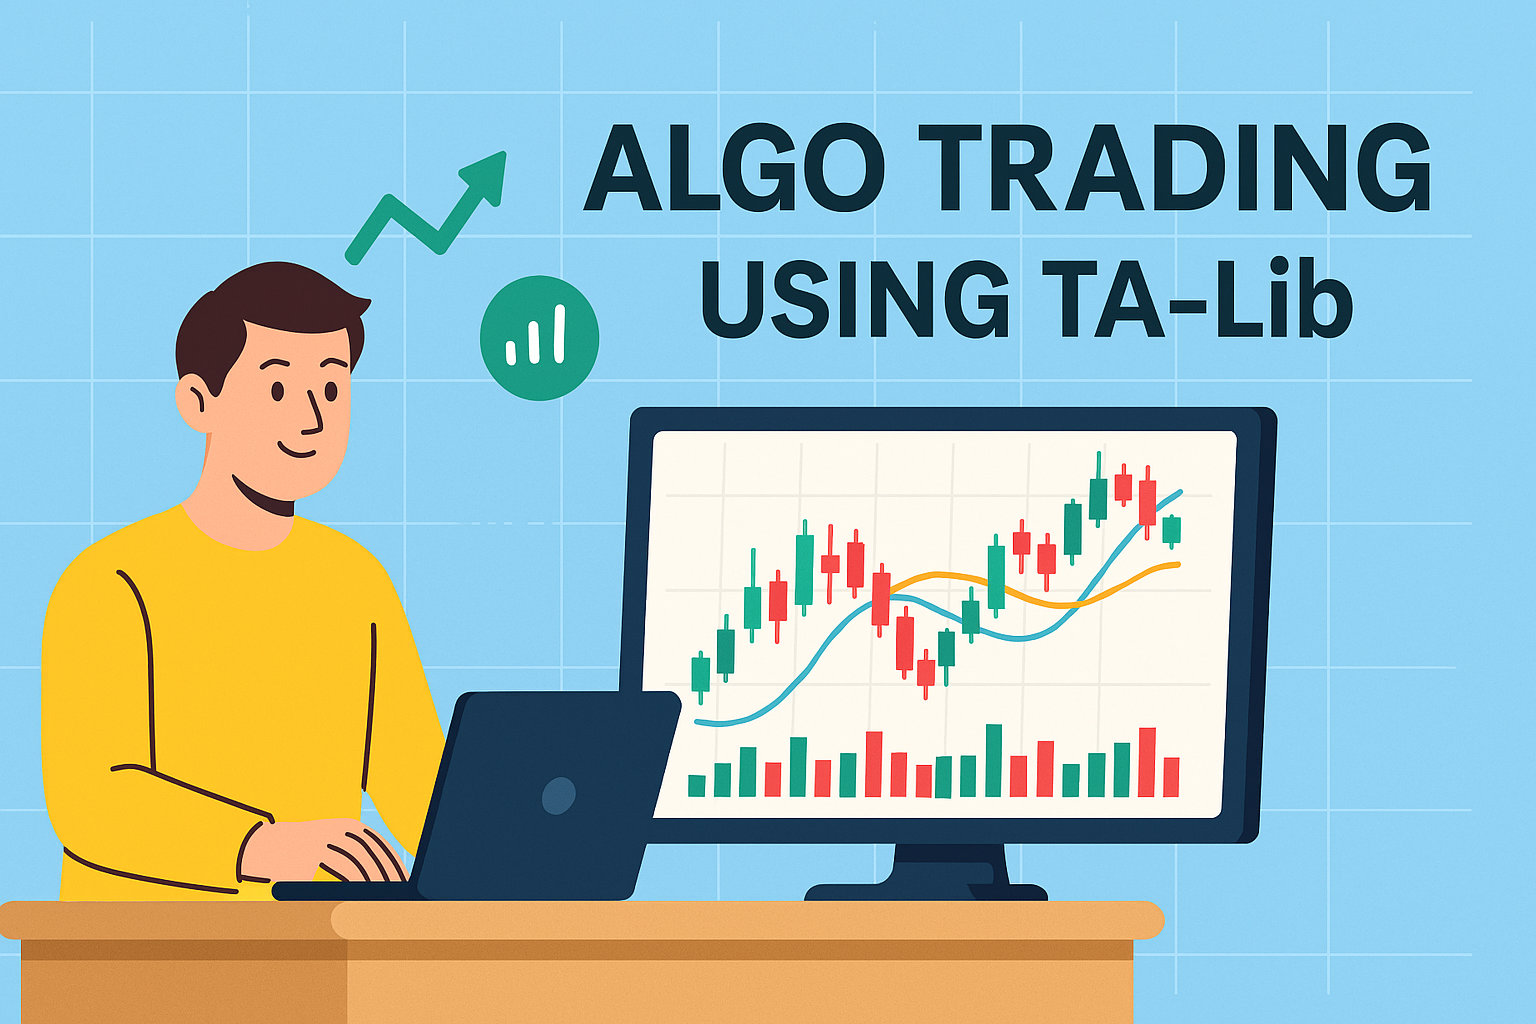
If you’re exploring algorithmic trading, technical indicators are essential for analyzing market trends and making informed decisions. TA-Lib (Technical Analysis Library) is a popular Python library that offers a comprehensive set of indicators like moving averages, RSI, MACD, Bollinger Bands, and more.
In this guide, we’ll cover:
- What TA-Lib is and why it’s useful
- How to install it
- Retrieving stock data using
yfinance - Using common technical indicators with TA-Lib
- A simple hands-on example
What is TA-Lib?
TA-Lib is widely used by traders for technical analysis, offering over 150 indicators. These help in identifying trends, momentum shifts, and volatility, providing insights into market behavior.
Installing TA-Lib
To install TA-Lib and yfinance, run:
pip install TA-Lib yfinanceFor some systems, additional dependencies may be required before installation. Check the official documentation if you encounter issues.
Retrieving Stock Data with yfinance
Before applying indicators, let’s fetch historical stock data using yfinance:
import yfinance as yf
import talib
import pandas as pd

# Get historical data for NVIDIA (NVDA)
symbol = "NVDA"
stock_data = yf.download(symbol, start="2023-01-01", end="2024-01-01")

# Display sample data
print(stock_data.head())
Applying Technical Indicators
Now, let’s apply some widely used technical indicators.
1. Simple Moving Average (SMA)
The Simple Moving Average (SMA) calculates the average closing price over a given period.
stock_data["SMA_20"] = talib.SMA(stock_data["Close"], timeperiod=20)2. Relative Strength Index (RSI)
RSI measures the magnitude of recent price changes to assess overbought or oversold conditions.
stock_data["RSI_14"] = talib.RSI(stock_data["Close"], timeperiod=14)3. Moving Average Convergence Divergence (MACD)
MACD helps traders identify potential trend reversals.
stock_data["MACD"], stock_data["MACD_signal"], _ = talib.MACD(stock_data["Close"], fastperiod=12, slowperiod=26, signalperiod=9)Visualizing the Indicators
We can use matplotlib to plot these indicators:
import matplotlib.pyplot as plt

plt.figure(figsize=(12, 6))
plt.plot(stock_data.index, stock_data["Close"], label="Close Price", color='blue')
plt.plot(stock_data.index, stock_data["SMA_20"], label="20-day SMA", color='orange')
plt.legend()
plt.title(f"{symbol} Stock Price and 20-day SMA")
plt.show()
Wrapping Up
TA-Lib simplifies the application of technical indicators, making it a valuable tool for algorithmic traders. In this guide, we covered:
- Installing TA-Lib
- Fetching stock data using
yfinance - Using indicators like SMA, RSI, and MACD
- Plotting technical indicators for analysis
Experimenting with different indicators will help refine your trading strategies. If you’re looking to get started with algorithmic trading using TA-Lib, check out their documentation here!


